How COVID-19 has Changed our Music Listening Habits 🕺
COVID-19 has brought enormous amounts of anxiety and uncertainty. This article shows how the pandemic has affected popular music listening habits. In collaboration with:
@OxfordInternetInstitute
Mar. 27, 2021
 on [Unsplash](https://unsplash.com/s/photos/moody?utm_source=unsplash&utm_medium=referral&utm_content=creditCopyText)](https://cdn-images-1.medium.com/max/10064/1*Z4Mg5DuKyADCCyFRHz-cyA.jpeg) Photo by Casey Horner on Unsplash
Photo by Casey Horner on Unsplash
I know I’m not alone when saying that dealing with COVID-19 has been an anxiety inducing experience. And why wouldn’t it be? With the spectre of illness and shelter-in-place orders, it make’s sense that the pandemic has brought enormous amounts of uncertainty to people all over the world. A common coping mechanism in the face of anxiety, grief and sadness is music (Van den Tol & Edwards, 2013). Music can serve a variety of uses in adverse situations including mood enhancement, self-regulation and catharsis (Garrido & Schubert, 2011). This article asks how the impact of the COVID-19 pandemic has affected music listening habits
Through some preliminary analysis I test that there is a negative relationship between the severity of the pandemic in a country and the “happiness” of that country’s trending music. In doing so we’ll test two explanatory variables that will serve as a proxy for the severity of the pandemic. All of the data for this analysis was collected November 30, 2020.
The first explanatory variable is the number of confirmed COVID-19 cases (per 100k) recorded in the previous week. Increased spread of the virus is likely to cause individuals’ anxiety or anguish — especially if they themselves, or a loved one, have contracted the virus. We might expect then that an increased number of recent cases to be accompanied by heightened levels of anxiety, grief or sadness which, this article would argue, would manifest in more individuals listening to sadder music.
The second explanatory variable that may affect listening habits is the stringency of government regulations with respect to the pandemic. This index is measured in the OxCOVID-19 Database as a composite of seven common government responses to the pandemic: school closings, workplace closings, public event cancellations, limits on gathering sizes, closure of public transportation, restrictions on international or domestic travel, and whether that country is “sheltering in place” (Mahdi et al., 2020). While not everyone is personally affected by the COVID-19 virus itself, the effect of government lockdowns are shared widely. As such, the anxiety a parent feels when their child’s school shuts down and they are scrambling to find childcare, or the anguish one might feel when they can no longer visit loved ones as a result of an international travel restriction may be yet another factor that manifests in broad music listening habits.
Setup
As indicated earlier, this article focuses at the country level, which allows for a broader analysis as well as more readily available data. In order to quantify the “musical happiness” of a country at a specific point in time, I turn to Spotify’s application programming interface (API). This API allows researchers to query artists, playlists and songs for their relevant meta-data. While musical preferences are generally diverse, we can use what music is currently trending in a country as an indicator of that country’s musical pulse. The Spotify account Top 50 Playlists creates collections of songs that are trending by country, updated daily. I collected the “Top 50 Playlist” for 20 unique countries across North America, Europe, South and East Asia, South America, and Africa on November 30, 2020. While limited by the countries available, this provides an interesting cross-section of musical tastes for a variety of countries.
In order to quantify the mood of a country’s trending playlist, I make use of the audio-features endpoint available through the Spotify API, which takes in a song ID and returns a variety of features about that song, one of which is what Spotify calls valence. Valence is “a measure from 0.0 to 1.0 describing the musical positiveness conveyed by a [song]. [Songs] with high valence sound more positive (e.g. happy, cheerful, euphoric), while [songs] with low valence sound more negative (e.g. sad, depressed, angry)” (Eriksson, 2016). I then take the valence of a country’s, trending songs.
An important factor to note, however, it that it’s possible that some countries have higher or lower valence music independent of the pandemic. We can adjust for this by calculating a baseline valence score for each country, and then calculating the log-ratio of that country’s current valence with the baseline valence. For consistency I also make use of the Top 50 Playlists account, which created a list of 50 songs that were popular throughout 2019 for each country and calculate that playlist’s mean valence for each country. By calculating this adjusted valence measure we then have a measure of how much happier or sadder the current trending music is in a given country relative to that country’s normal valence. An adjusted valence score of 0 indicates no change in valence, a positive score indicates a higher than normal valence and a negative score indicates a lower than normal valence.
To calculate the severity of the pandemic I also query the OxCOVID19 database for the number of cases per 100k that each country counted in the week preceding November 30, 2020 — as well as the most recent government stringency index indicator discussed earlier.
Analysis
After scraping each country’s current “Top 50” and “Hits of 2019” playlist, I calculate. The distribution of each country’s baseline valence and the distribution of each country’s adjusted valence are visualized below. As can be seen there is a fair amount of variation between each country’s valence score, as well as each country’s baseline valence and adjusted valence — with Turkey and Russia having the lowest baseline valence and Peru having the highest.
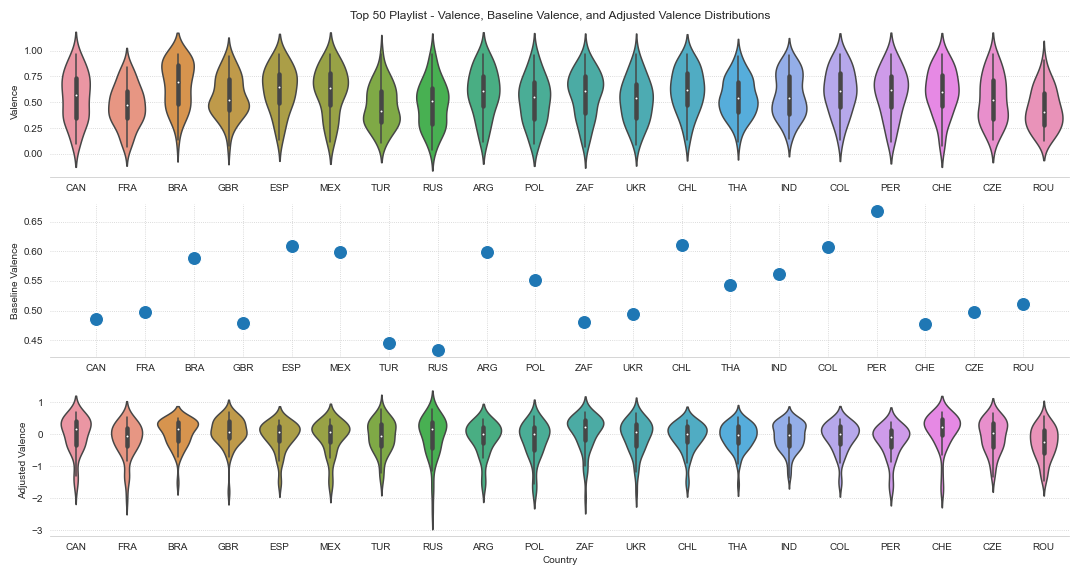 Distribution of country song valences, baseline song valence and adjusted valence
I first test that a country’s musical mood may be a function of the number of COVID-19 cases confirmed in the past week, adjusted for population differences. The figure below shows first the unadjusted mean valence for each country as a function of that country’s previous week’s cases per 100k people. To its right is the same plot but using the mean adjusted valence instead of the unadjusted valence. As can be seen, if we didn’t account for the baseline valence of a country’s music we would suspect that there is a slight negative relationship between confirmed cases and valence; however, this relationship becomes negligible after we control for the baseline score. This coupled with the wide confidence intervals suggests little relationship between these two variables.
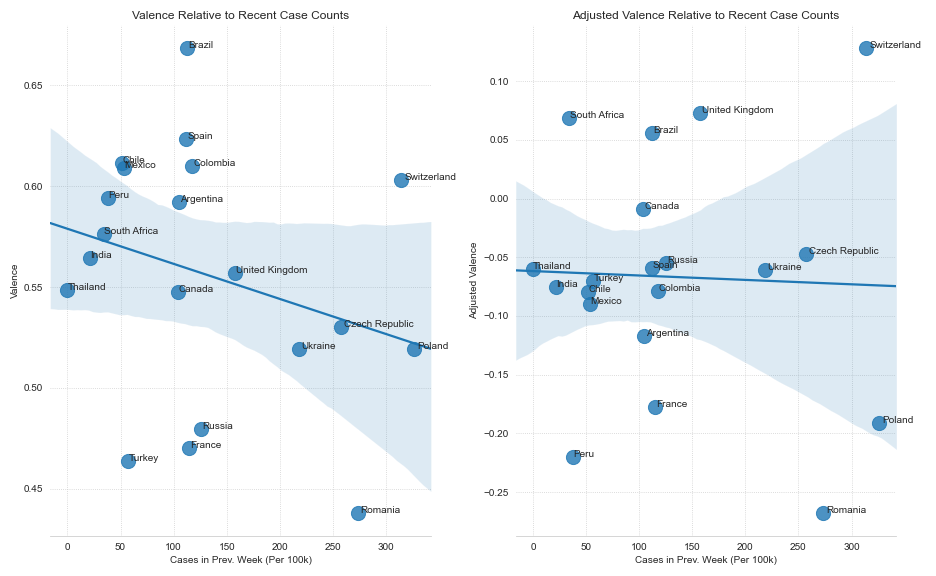 Valence as a function of COVID-19 cases
In the countries with the highest cumulative proportion of cases, a relatively small percentage (4–8%) of the population has contracted the virus (Mahidi et al, 2020). Given COVID-19’s unequal spread across socio-economic and racial lines, it is quite possible that many people are not directly affected by the virus itself, which could explain why the relationship between valence and confirmed cases is small. However, if a country goes into national lockdown, the effects of that policy are felt widely. This could be yet another driver of anxiety. Using the government stringency index I plot a country’s adjusted valence as a function of the severity of government restrictions. The below figure shows a strong negative relationship between the two variables, indicating that popular music may track the anxieties arising from such policies.
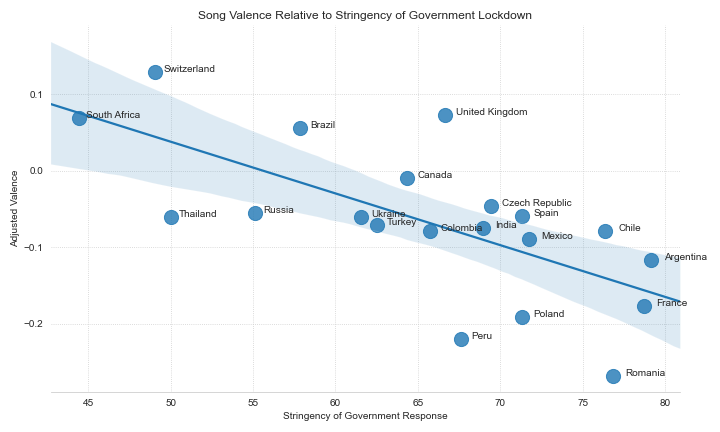 Valence as a function of government restriction severity
Conclusion and Limitations
One of the key limitations of this analysis is that trending music and pandemic indicators were only collected for one day: November 30, 2020. A more robust analysis would also include how changes in pandemic indicators relate to changes in music listening habits. However, this poses a problem in that music listening habits are also seasonal. One reason that I did not include multiple days worth of data is that Christmas music, which tends to be higher valence, began creeping into the “Top 50 Playlist” for largely Christian countries. This is another confounding variable that would skew results, but could be controlled for by using a seasonally adjusted measure of valence.
Additionally, valance is an amorphous metric that is likely culturally dependent. While using Spotify’s valence algorithm provides consistency across cultures, qualitative methods may be better suited for such a subjective and culturally dependent metric. Finally, it is obvious that a country-level analysis may be too broad to fully capture the effect of the pandemic on individuals. This limitation is a function of the data available and could be remedied by having data regarding individuals music habits.
This article explores how the COVID-19 pandemic has changed country-level music listening habits. By bringing in trending music from 20 different countries, along with current COVID-19 statistics like the number of cases or severity of government response, it is clear that the pandemic is associated with sadder music.
References
Eriksson, M. (2016). Close reading big data: The Echo Nest and the production of (rotten) music metadata. First Monday.
Garrido, S., & Schubert, E. (2011). Negative emotion in music: What is the attraction? A qualitative study.
Mahdi, A., Blaszczyk, P., Dlotko, P., Salvi, D., Chan, T. S. T., Harvey, J., & Zarebski, A. E. (2020). OxCOVID19 Database: a multimodal data repository for better understanding the global impact of COVID-19. medRxiv.
Van den Tol, A. J., & Edwards, J. (2013). Exploring a rationale for choosing to listen to sad music when feeling sad. Psychology of music, 41(4), 440–465.